Research Data Services Librarian Alfredo González-Espinoza wants to make it easier for CMU researchers to find related projects and opportunities for collaboration across disciplines.
Kilthub, CMU’s institutional repository, contains around 4,000 theses uploaded by graduate students across the university. But within Kilthub, there’s no easy way to explore how a research topic might be connected to other areas of campus. González-Espinoza began looking for ways to gather and display this data, making it accessible to students and encouraging them to engage more with other researchers.
Over winter break, Mellon College of Science student Chehak Arora, who is part of the Master’s of Science in Data Analytics for Science (MS-DAS) program, reached out to González-Espinoza. Arora is a member of the Tartan Research Data Alliance led by González-Espinoza and Open Knowledge Librarian Emily Bongiovanni. The program aims to create a community of practice around research data management, to foster good research practices, introduce researchers to the support and services the libraries offer, and explore networking opportunities or identify potential collaborations.
Arora hoped González-Espinoza could help connect her with data projects happening on campus, so she could practice her skills and contribute to meaningful work being done by the CMU community. González-Espinoza invited Arora to join his project, and together they worked to visualize graduate research at CMU in a way that emphasizes connections between disciplines.
Goal
- Use Natural Language Processing techniques and Large Language Models such as BERT to organize and analyze academic theses based on their content.
How We Helped
- Over the course of the project, Arora learned how to use the BERT-based sentence transformers package to process text from thesis abstracts and transform them into a semantic map.
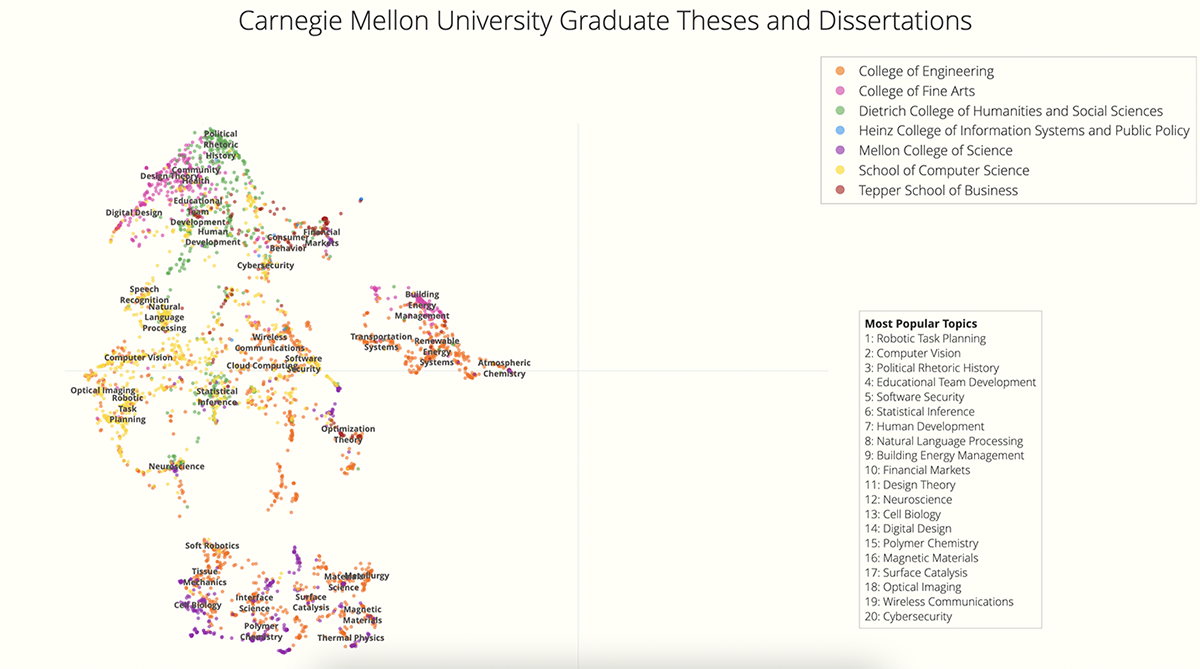
- González-Espinoza and Arora used HDBSCAN — Hierarchical Density-Based Spatial Clustering of Applications with Noise — and other techniques to visualize a high dimensionality map of research similarities in a two-dimensional, interactive space.
Results
- The interactive scatter plot, which was first shared as a part of the Love Data Week 2025 celebration, enables users to zoom, pan, and hover over data points to explore research trends, document titles, and topic distributions across colleges.
- AThe visualization captures the semantic meaning of the research, rather than just keywords, to show conceptual relationships between different works. With the visualization, users can explore connections between different fields and find potential areas for new research. It can even be used to identify unique research opportunities for collaboration by highlighting gaps inside a field or across disciplines.
- Arora is now using the skills she gained through her work on the project to study sentiment analysis in banking for her capstone project.