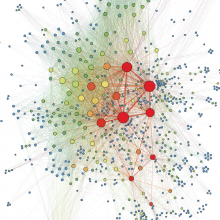
Are you currently involved in work that could be augmented by visualizing your data for analysis or to communicate your findings to the public? Would you like to further your skills or learn new ways to make charts, graphs, maps, or other types of visualizations?
The Data Visualization Research Guide will introduce you to the wide world of data, including data types (qualitative, quantitative, ethnographic, geospatial, etc.), finding data, visualizing data, and managing data.
Data visualization, or the techniques used to visually display or communicate data, is an obvious output of our research or data analysis. The idea is to quickly and clearly display data for purposes of analysis or presentation. Being able to effectively communicate your data to an audience is a necessary part of any project.
Tableau
Tableau is a software that helps you create more dynamic and appealing visualizations for your class projects, research, or just for fun! With an intuitive interface that encourages exploration, Tableau can help you grow and expand your creativity around crafting and designing data visualizations. At CMU Libraries, we can help you learn recommended practices for using Tableau whether you're a beginner data user or more advanced in your skills.
Primary Contact(s)
Manage
Manage Information & Data
Work with our specialists to evaluate, select, and implement the tools to organize your data and keep your project on track.

