
The last time I talked about the 'Discovering the Data Universe' course on Tartan Datascapes (check it out here if you missed it!), my colleague Dr. Emma Slayton (Data Curation, Visualization, and GIS Specialist at CMU Libraries) and I were in the final stages of planning the course. As this course took place in Mini-3 of the spring 2020 semester (January to late-February), we were grateful to finish instruction of the course before classes were taken online. In this installment of Tartan Datascapes, Emma and I are thrilled to share a summary of the course and a glimpse into the student's experiences. Co-teaching this course with Emma was a great experience, as we both specialize in different, yet complementary, sides of data education, with my proficiency in data management, and her excellent skills in data visualization instruction!
We had a total of 6 students take the course, primarily from statistics backgrounds. The aim of the course was to take students on a journey of engaging deeply with a dataset, learning how to describe, organize, visualize, and share their data, with the ultimate goal of helping students learn how to tell effective stories with their data. We both agree that this goal was fully realized in the course, as we had three teams of students provide innovative, unique stories around their given dataset. At the start of the course, the three teams were each assigned a dataset that they engaged with throughout the mini, learning several aspects of how to use the data to tell an effective story. Here were the three teams:
Team Archives: This dataset was a list of historical photographs of the Margaret Morrison Carnegie School for Women held and managed by the University Archives in CMU Libraries (visit them here).
Team Census: The U.S. census, required by law, aims to count every person living in the United States and five U.S. territories as well as record data about different aspects of their lives (income, family size, ethnicity, etc.). The team's challenge was to evaluate census data to look for stories about the Pittsburgh Area.
Team Crime: We asked students to analyze a public data set that has information on incident reports from the City of Pittsburgh Police Department. This data was accessed through the Western Pennsylvania Regional Data Center's website, which you can visit here!
We challenged our students to treat these data sets as if they were created by themselves, caring for the data throughout its entire life cycle from collection to storage (see the figure below for an image describing this life cycle).
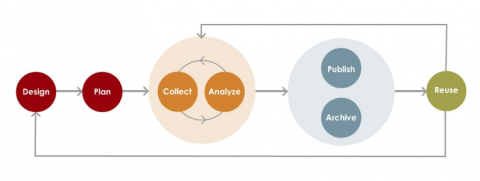
This meant guiding our students through exercises to learn how the data were collected and for what purpose, create a data management plan (DMPTool) for how those data would be kept and shared throughout the project (GitHub, Open Science Framework), analyze their data (R, content analysis), and create visualizations (Tableau, R) based on narrative discovered through this process.
It was an enlightening experience for all involved, both the students and the instructors! We were also grateful to have several guest lectures from folks in CMU Libraries, including Kate Barbera (on archival images as data), Angelina Spotts (on metadata), Sarah Young (on finding data online), and Zach Furste (on software preservation). Are you reading this and thinking 'wow, I wish I could take this course!'? Stay tuned - Emma and I are currently in the planning stages for next stages of the course, and we are incredibly excited for its future. Keep your eyes on Tartan Datascapes for updates on the course!
Now, let's shed some light on the burning question, 'can a plant be a dataset'? Emma and I both agree (and we hope our students do too!) that the answer to this question is a resounding yes! On the first day of class, we posed this question to our students and were met with some slight (and understandable!) confusion - how can a plant be a dataset? However, after we engaged in a discussion on the myriad data sources that can come from plants, we were able to help students better understand how data truly surrounds us in almost everything we see. What are some of these data sources in plants? Here's three examples:
1. Measurements of photorespiration
2. The shades of green present the plant in the RBG color model
3. How many leaves are there? What are the average sizes of the leaves? What is the maximum and minimum size of the leaves? What are some other ways you can describe its appearance through numbers? Or words?
So there you have it. Next time you find yourself in a greenhouse or a quaint coffee shop filled with succulents hanging on the wall, marvel at all the brilliant sources of data surrounding you!

Image Description: two cups of coffee on a wooden table surrounded by green succulent plants. Photo credit to Nathan Dumlao on Unsplash.
It may be the end of the semester, but there's still a lot of great ways to engage with CMU Libraries virtually! You can check out our LibGuides, specialized research guides created by our subject experts, including the Data 101 guide, which has a particular Tartan Datascapes flavour. We also have a variety of online databases and resources at your disposal. Looking for some more specialized support? The Data Collaborations Office Hours are now virtual until further notice, and you can join us on Wednesdays from 1-3pm to learn how to get involved. Check out the Data Collaborations Program website here for more information!
And of course, please email me if you'd like some help on your journey as a researcher/scholar/awesome human being here at CMU. Remember, we all use data, regardless of our discipline. If you think something might be data, you are likely correct and I can help you develop good habits for managing it! If you'd like to have your research data featured on Tartan Datascapes, please fill out the Google Form here to get in touch!